


US census language map
Monday, September 02, 2013
Regarding a previous post on the distribution of languages spoken at home in the US (where Italian showed a marked decline), here is an interactive map showing which counties have more than 10% of the population using a language other than English. Most of these are Spanish, but we do see some other languages such as French in Louisiana, Portuguese in Massachusetts, and even Russian in Alaska. Navajo is also quite prevalent.
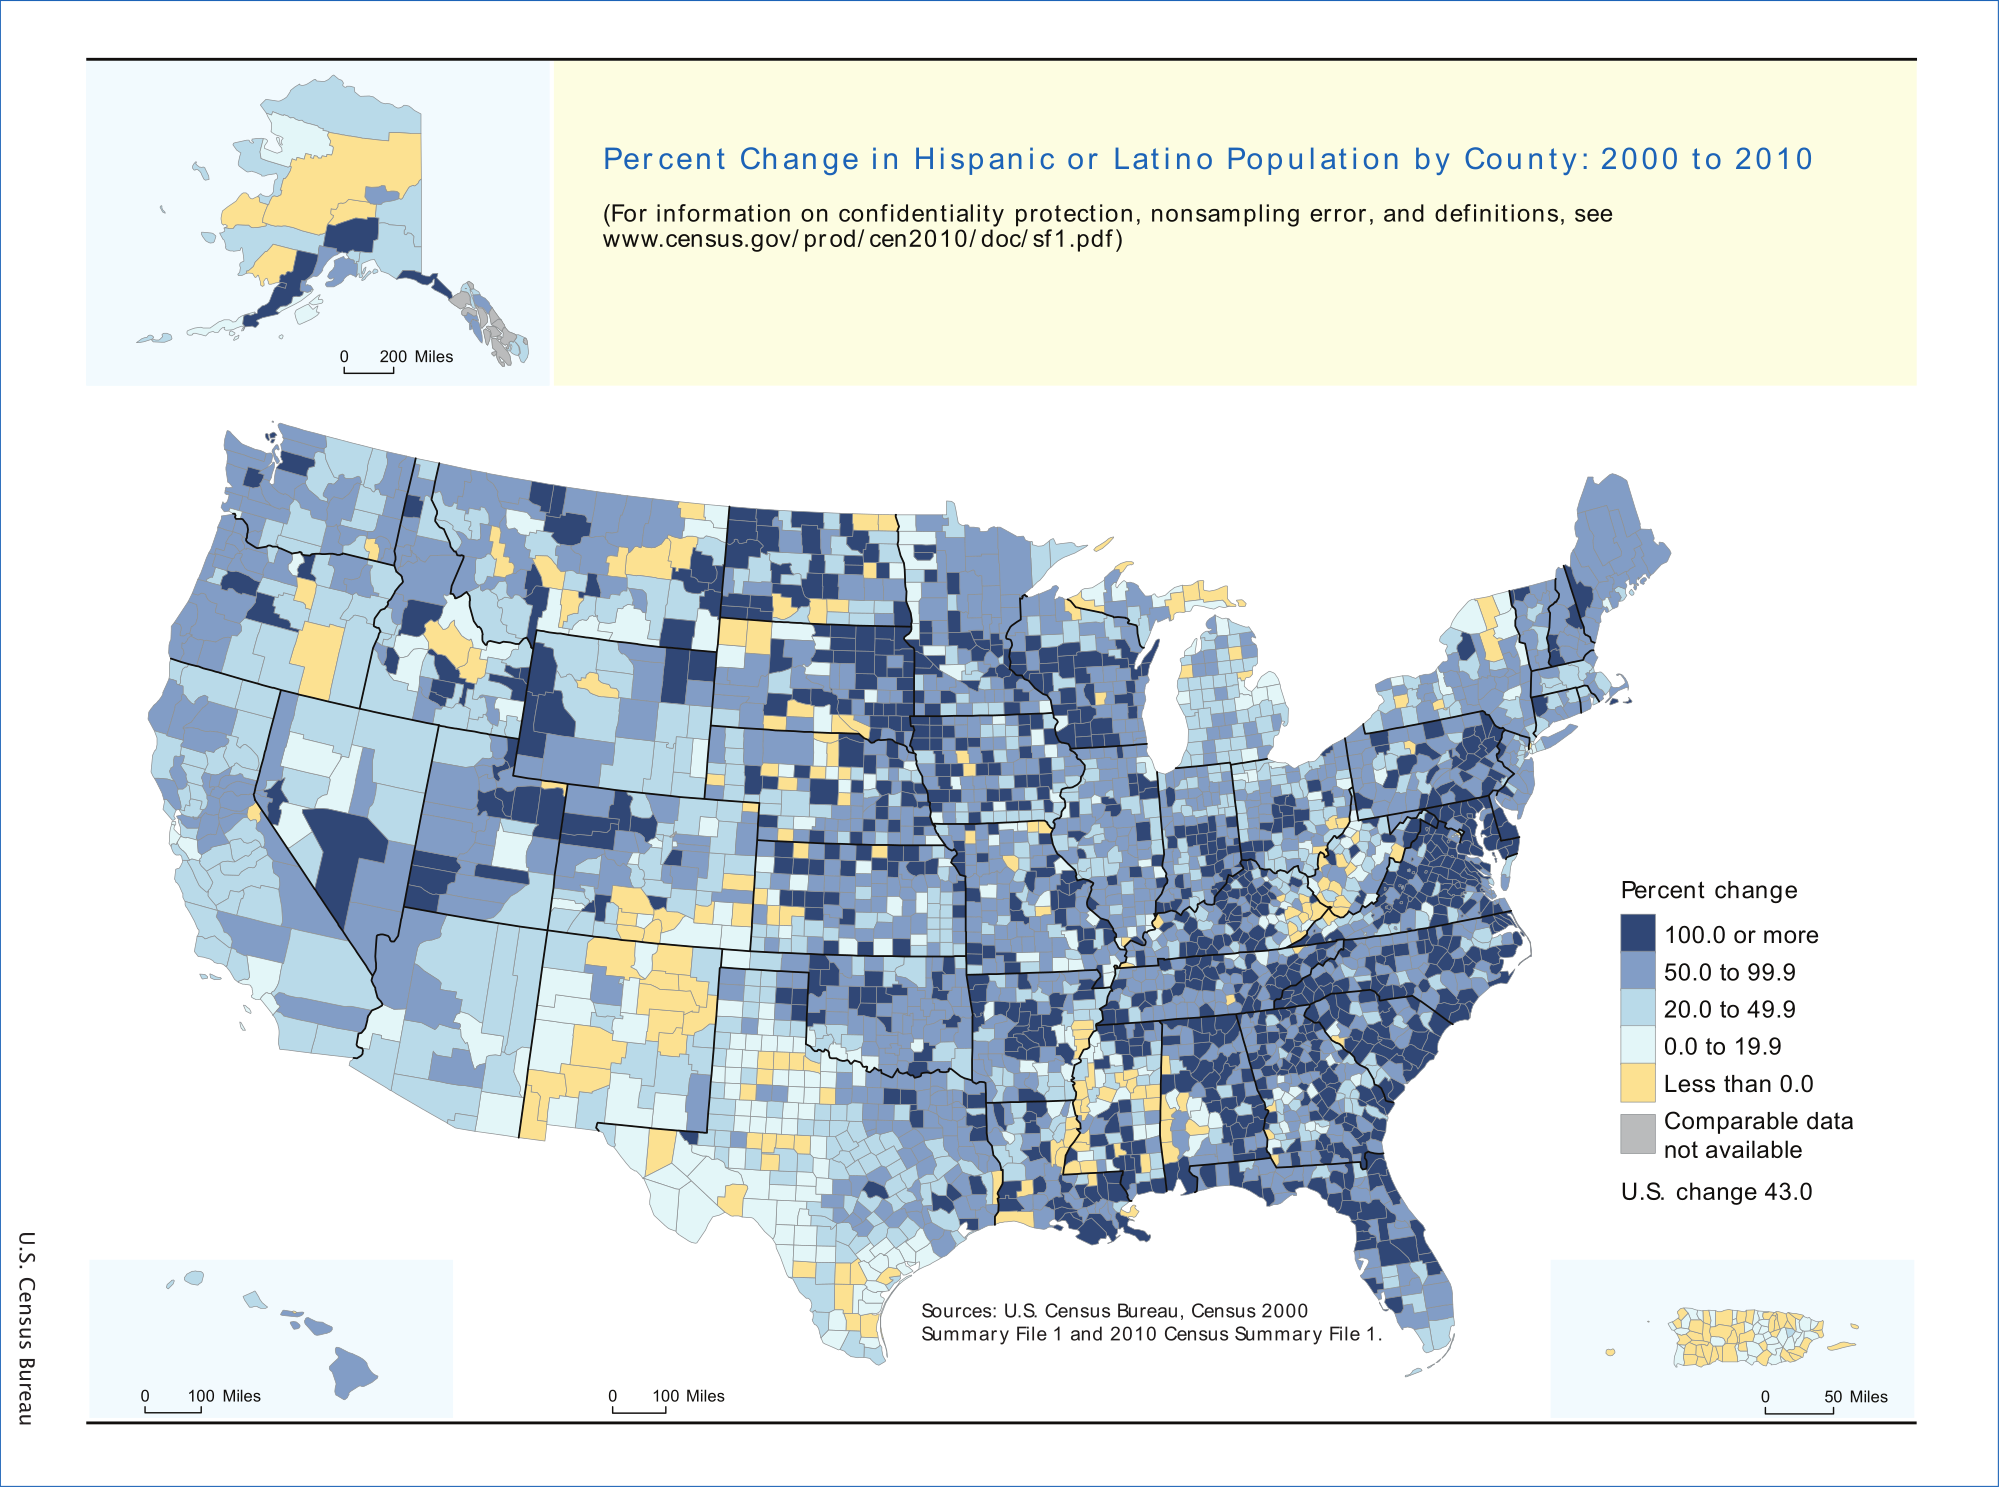
For the percent change in Latino population over ten years (2000 to 2010), Wikipedia has the following image. This of course does not necessarily reflect usage of the language itself (Latinos who do not speak Spanish are common), and dividing it up by county makes for quite the messy map. I prefer this table showing the percentage increase by state in the far right column.
| State/Territory | Pop 2000 | % pop 2000 | Pop 2010 | % pop 2010 | % growth 2000-2010 |
|---|---|---|---|---|---|
| 95,076 | 2.4% | 235,682 | 5.1% | +147.9% | |
| 75,830 | 1.7% | 185,602 | 3.9% | +144.8% | |
| 123,838 | 2.2% | 290,059 | 4.6% | +134.2% | |
| 59,939 | 1.5% | 132,836 | 3.1% | +121.6% | |
| 86,866 | 3.2% | 186,050 | 6.4% | +114.2% | |
| 378,963 | 4.7% | 800,120 | 8.4% | +111.1% | |
| 227,916 | 4.3% | 470,632 | 8.2% | +106.5% | |
| 39,569 | 1.4% | 81,481 | 2.7% | +105.9% | |
| 10,903 | 1.4% | 22,119 | 2.7% | +102.9% | |
| 37,277 | 4.8% | 73,221 | 8.2% | +96.4% | |
| 435,227 | 5.3% | 853,689 | 8.8% | +96.1% | |
| 329,540 | 4.7% | 631,825 | 7.9% | +91.7% | |
| 179,304 | 5.2% | 332,007 | 8.9% | +85.2% | |
| 82,473 | 2.8% | 151,544 | 5.0% | +83.7% | |
| 394,088 | 3.2% | 719,660 | 5.7% | +82.6% | |
| 393,970 | 19.7% | 716,501 | 26.5% | +81.9% | |
| 214,536 | 3.5% | 389,707 | 6.0% | +81.7% | |
| 12,279 | 0.7% | 22,268 | 1.2% | +81.4% | |
| 9,360 | 0.7% | 16,935 | 1.3% | +80.9% | |
| 118,592 | 2.1% | 212,470 | 3.5% | +79.2% | |
| 20,489 | 1.7% | 36,704 | 2.8% | +79.1% | |
| 107,738 | 2.4% | 192,560 | 4.2% | +78.7% | |
| 201,559 | 9.0% | 358,340 | 13.0% | +77.8% | |
| 94,425 | 5.5% | 167,405 | 9.2% | +77.3% | |
| 143,382 | 2.9% | 250,258 | 4.7% | +74.5% | |
| 192,921 | 3.6% | 336,056 | 5.9% | +74.2% | |
| 101,690 | 7.9% | 175,901 | 11.2% | +73.0% | |
| 7,786 | 1.2% | 13,467 | 2.0% | +73.0% | |
| 441,509 | 7.5% | 755,790 | 11.2% | +71.2% | |
| 5,504 | 0.9% | 9,208 | 1.5% | +67.3% | |
| 275,314 | 8.0% | 450,062 | 11.7% | +63.5% | |
| 217,123 | 1.9% | 354,674 | 3.1% | +63.4% | |
| 188,252 | 7.0% | 300,042 | 10.5% | +59.4% | |
| 31,669 | 6.4% | 50,231 | 8.9% | +58.6% | |
| 18,081 | 2.0% | 28,565 | 2.9% | +58.0% | |
| 2,682,715 | 16.8% | 4,223,806 | 22.5% | +57.4% | |
| 25,852 | 4.1% | 39,250 | 5.5% | +51.8% | |
| 320,323 | 9.4% | 479,087 | 13.4% | +49.6% | |
| 428,729 | 6.8% | 627,654 | 9.6% | +46.4% | |
| 1,295,617 | 25.3% | 1,895,149 | 29.6% | +46.3% | |
| 90,820 | 8.7% | 130,655 | 12.4% | +43.9% | |
| 6,669,666 | 32.0% | 9,460,921 | 37.6% | +41.8% | |
| 735,801 | 17.1% | 1,038,687 | 20.7% | +41.2% | |
| 1,117,191 | 13.3% | 1,555,144 | 17.7% | +39.2% | |
| 87,699 | 7.2% | 120,842 | 8.9% | +37.8% | |
| 323,877 | 3.3% | 436,358 | 4.4% | +34.7% | |
| 1,530,262 | 12.3% | 2,027,578 | 15.8% | +32.5% | |
| 10,966,556 | 32.4% | 14,013,719 | 37.6% | +27.8% | |
| 765,386 | 42.1% | 953,403 | 46.3% | +24.6% | |
| 44,953 | 7.9% | 54,749 | 9.1% | +21.8% | |
| 2,867,583 | 15.1% | 3,416,922 | 17.6% | +19.2% | |
| 3,762,746 | 98.8% | 3,688,455 | 99.0% | +0.2% | |
| 15,196 | 14.0% | ||||
| 35,305,818 | 12.5% | 50,477,594 | 16.3% | +43.0% |
0 comments:
Post a Comment